Email Marketing: Pro Tips for A/B-Split Testing
By Susan Brown Faghani
Manager, Marketing and Sales Communication, L-Soft
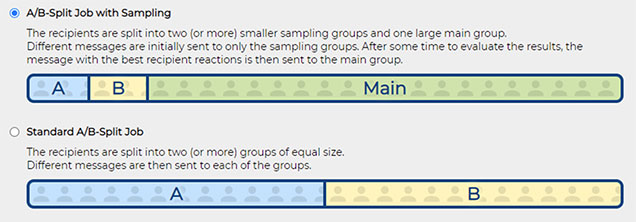
One of the true power tools we have as email marketers and communicators is A/B-split testing. In short, you send two or more different versions of a mailing to random splits of your subscribers and compare the response rates to see which version performs better. Voila! Now you have insights to optimize and customize future campaigns.
That said, to get the most meaningful data from A/B-split testing, you'll need a bit more thought and planning. These five tips will help you make the most of your A/B-split testing.
1. Make Sure That You Have Enough Subscribers
A/B-split testing is based on statistics, probabilities and sampling. The smaller your sample size, the larger the likelihood that random statistical noise can influence the data, making it difficult to reach statistically significant conclusions. So first, make sure that you have enough subscribers to obtain meaningful data.
Case in point: If you only have 100 subscribers and send two variants to 50 subscribers each and get a 30 percent open-up rate from the first variant and a 20 percent open-up rate from the second, you might conclude that the first variant was far more successful.
However, those percentages are equivalent to 15 and 10 open-ups respectively – a difference of just 5. This makes it impossible to state with any confidence whether the results are directly attributable to the differences between the two variants or simply statistical noise. So, focus on growing your list of subscribers before you spend serious time on A/B-split testing.
2. Decide What You Want to Test
Once your subscriber database is large enough for A/B-split testing, the next step is to decide exactly what you want to evaluate. Test one aspect of your message at a time, or it'll be impossible to identify which change triggered the improvement in performance among variants. For example, subject lines are commonly tested because they determine whether subscribers will even open the email message. If you don't pull your subscribers in, any compelling content that you may offer is never seen. Time of delivery is another widely used test. Subscribers are more likely to open a message if it arrives on a day and time when they're interested and able to act on it. When it comes to content, you can try a different layout, image, copy or call-to-action. The possibilities are endless.
3. Decide How to Measure Success
When conducting A/B-split testing with an email marketing campaign, you're measuring campaign success in terms of open-ups, click-throughs or conversions. These three metrics are not the same and can give contradictory results. For example, let's say that you work with alumni donor relations at a university and send an email marketing message to 5000 subscribers on a Tuesday morning with these two subject line variants but otherwise identical content:
Variant A:
Not Too Late! Donate by April 1 to the Goode University Scholarship Fund
Variant B:
Make a Difference: Can Goode University Count on Your Support?
One week later, you check your data and find that Variant A had an open-up rate of 24 percent and a click-through rate of 8 percent, compared to an open-up rate of 28 percent and a click-through rate of 12 percent for Variant B. This would make it seem like Variant B was the clear winner. However, then you dig deeper and find that Variant A had a conversion rate of 5 percent, which means that 5 percent of the recipients made a donation while Variant B only had a conversion rate of 3 percent. Why the discrepancy? Perhaps what was happening is that while the subject line of Variant B was more effective in enticing the recipients to open the email and click through to the donation website, its lack of a clear end date for the donation campaign made the need to make an immediate donation appear less urgent.
So, as you can see, it's important to decide which metric to use for evaluating success. In this case, is Variant B more valuable because more recipients viewed the email and clicked through to the donation website, which can lead to a larger number of future donations? Or is Variant A more valuable because it led to a larger number of donations now, even if fewer total recipients bothered to open the email message?
4. Evaluate Whether Your Results Are Statistically Significant
For data to be considered statistically significant, you want to achieve at least a 95 percent confidence level, which means that there is a 95 percent likelihood that the results are due to the actual differences between the two variants. There are mathematical formulas that can be used to calculate whether certain results are statistically significant and the confidence level. Many free A/B-split test significance calculators are also available on the Internet, allowing you to simply input your sample sizes and conversion numbers in a form, which then automatically calculates whether the results are statistically significant.
Let's look at an example:
Variant A was sent to 400 recipients and 40 of them clicked through to the website (10 percent rate).
Variant B was sent to 400 recipients and 52 of them clicked through to the website (13 percent rate).
Are these results statistically significant, meaning that we can conclude that the better results for Variant B are highly likely attributable to the differences between the two variants? No, because the numbers fail to meet the 95 percent confidence level.
On the other hand, let's look at another example:
Variant A was sent to 1600 recipients and 160 of them clicked through to the website (10 percent rate).
Variant B was sent to 1600 recipients and 208 of them clicked through to the website (13 percent rate).
As you can see, the click rates are the same, but in this case because of the larger sample size, the results are statistically significant not just at 95 percent confidence but also at the higher 99 percent confidence level.
5. Be Realistic with Your Expectations
Remember, there are no miracles or magic bullets. Your testing won't reveal a simple tweak that leads to an earth-shattering improvement in campaign performance. Frequently, the data will be inconclusive. Don't let this discourage you. Instead, take an incremental approach. A/B-split testing is a long-term commitment and an ongoing process dedicated to learning about and more closely connecting with your particular – and unique – target audience. Whenever you do find statistically significant results, implement what you learned in your next campaign, then move on to test something else, and build on it.
LISTSERV Maestro 11.0 is the latest version of L-Soft's email marketing platform, which makes it easy to create and send A/B-split campaigns and customized content to your subscribers with in-depth tracking, reporting and analytics.
See how LISTSERV Maestro can help your organization:
https://www.lsoft.com/products/maestro.asp

Related Video Tutorials
|
LISTSERV is a registered trademark licensed to L-Soft international, Inc.
See Guidelines for Proper Usage of the LISTSERV Trademark for more details.
All other trademarks, both marked and unmarked, are the property of their respective owners.


